 New Ability Energy
Sizing a commercial array from interval data
The working behind a proposal: what gets requested, what gets modelled, what gets checked, and where a system stops being worth building.
What is requested, and why
Three inputs open a proposal: a recent electricity bill, access to your interval data, and a site visit. The bill establishes the tariff structure you are actually on. The interval data establishes the shape of the load underneath it. The visit establishes whether the site can physically take what the first two suggest.
Interval data is held by your retailer and released on request with your permission. It records consumption at fixed intervals across every day the site has been running, which is the only record that shows when you draw rather than how much.
Modelling the load
The load shape is modelled against the tariff before any array is sized. Two sites with identical roofs and identical annual consumption can want completely different systems, because a site that draws hard from six in the morning and a site that peaks mid-afternoon through summer are buying different things from the same panels.
This is also where a system stops being worth building. Where the modelled return does not justify the capital, the proposal says so rather than quietly reducing the scope.
Network and switchboard constraints
Two constraints bound the result regardless of what the model wants. Network export limits cap what can be sent back, which changes the value of generation produced above the site's own draw. Switchboard capacity caps what can be connected at all.
Both are established at the site visit, and both are written into the proposal as assumptions rather than left implicit.
Where storage earns its keep
Storage is modelled the same way the array is, against the load shape and the tariff, before a kWh figure goes on paper. It earns its keep in three situations: a tariff spread worth arbitraging, demand charges worth shaving, or an outage that genuinely costs the business money.
Where none of those apply, the honest answer is often no battery yet and a switchboard that will take one later without being rebuilt.
A worked example
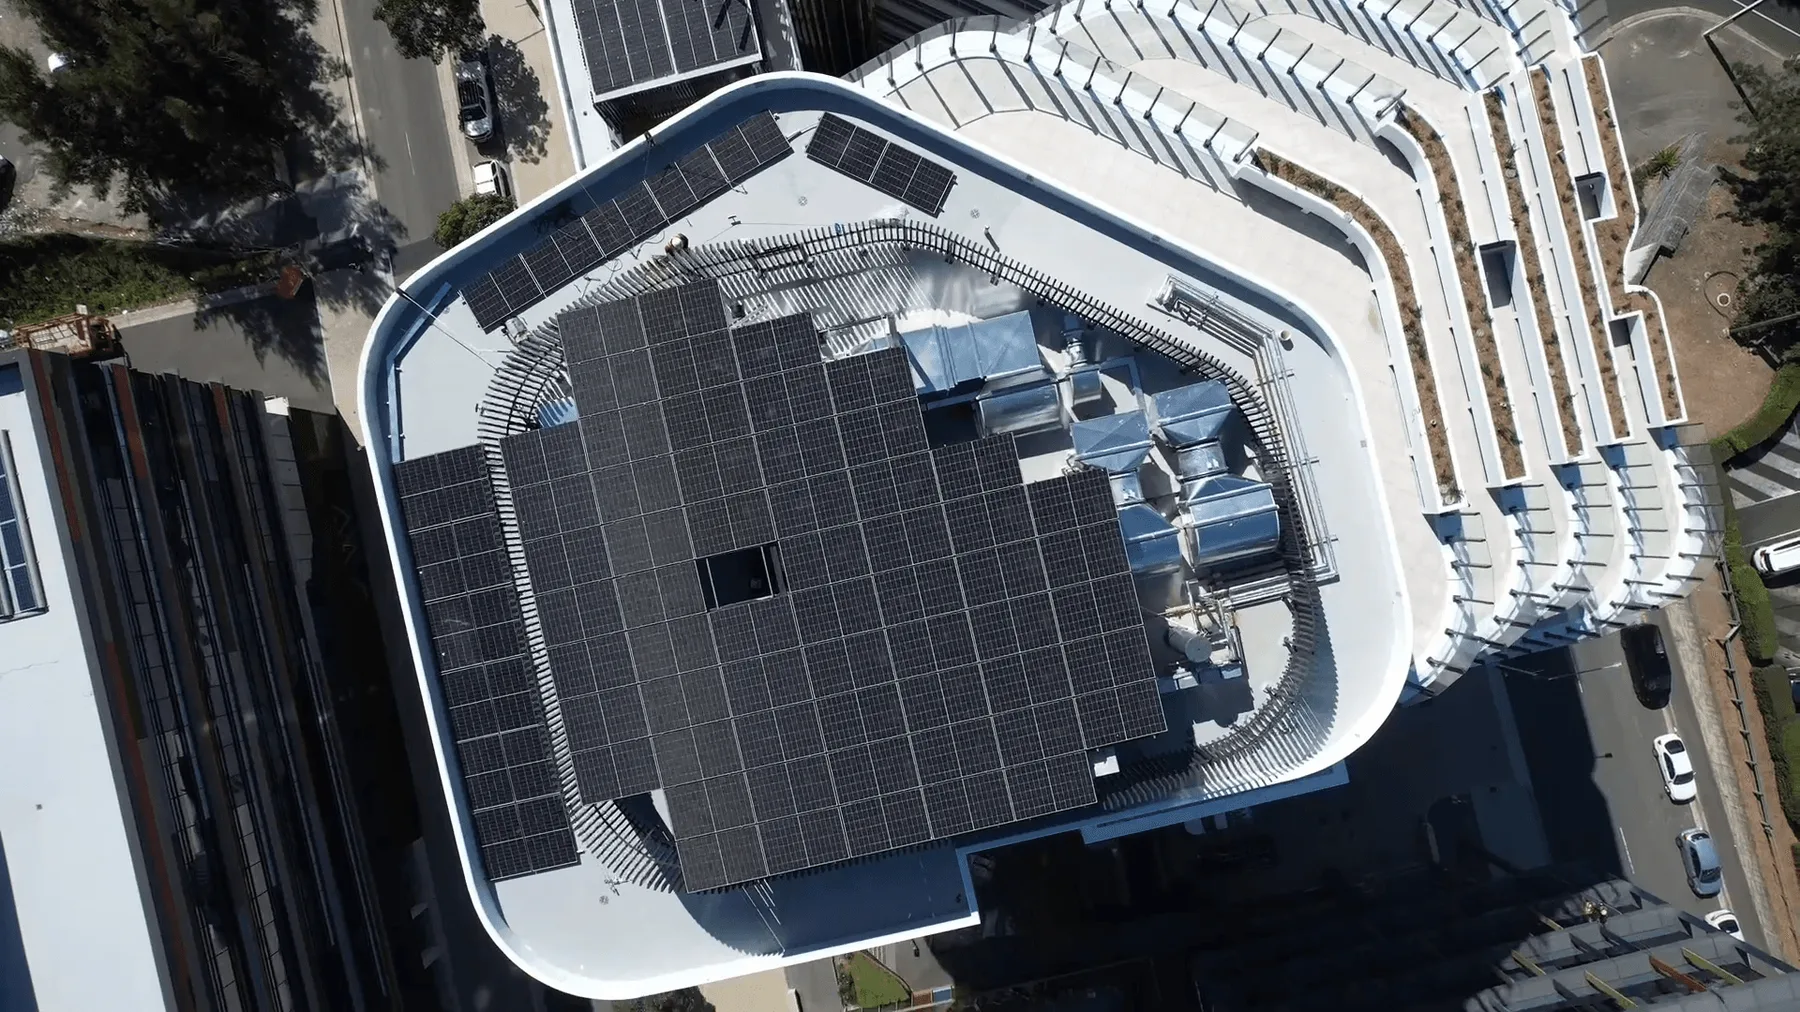
Two Murray Rose Avenue, Sydney Olympic Park, is a 59.4 kW array on a crowded roof, delivered with Ampcore Electrical around half-metre code clearances and a concrete deck that had to stay waterproof. Where Level 15 ran out of room, the dual-glass panels became the roof of a custom steel canopy.
The figures below are published measurements and estimates from that job, not projections from a price list. The generation figure is measured; the savings figures are estimates derived from it.
- System size
- 59.4 kW
- Generated each year
- 89,264 kWh
- Estimated annual saving
- $8,728
- Estimated saving over its life
- $212,213
- CO₂ avoided each year
- ~73 tonnes
What happens after commissioning
Monitoring runs from day one and performance is checked against the model that produced the proposal. That comparison is the point of writing the assumptions down: a system that underperforms its model is a fault to find, not a disappointment to absorb.
You receive the commissioning documents and warranties, and a servicing schedule is agreed. Faults are flagged from the data rather than from a bill shock three months later.
A site visit and your interval data come before any number does. Request a quote.