 New Ability Energy
Size it from the load, not the roof
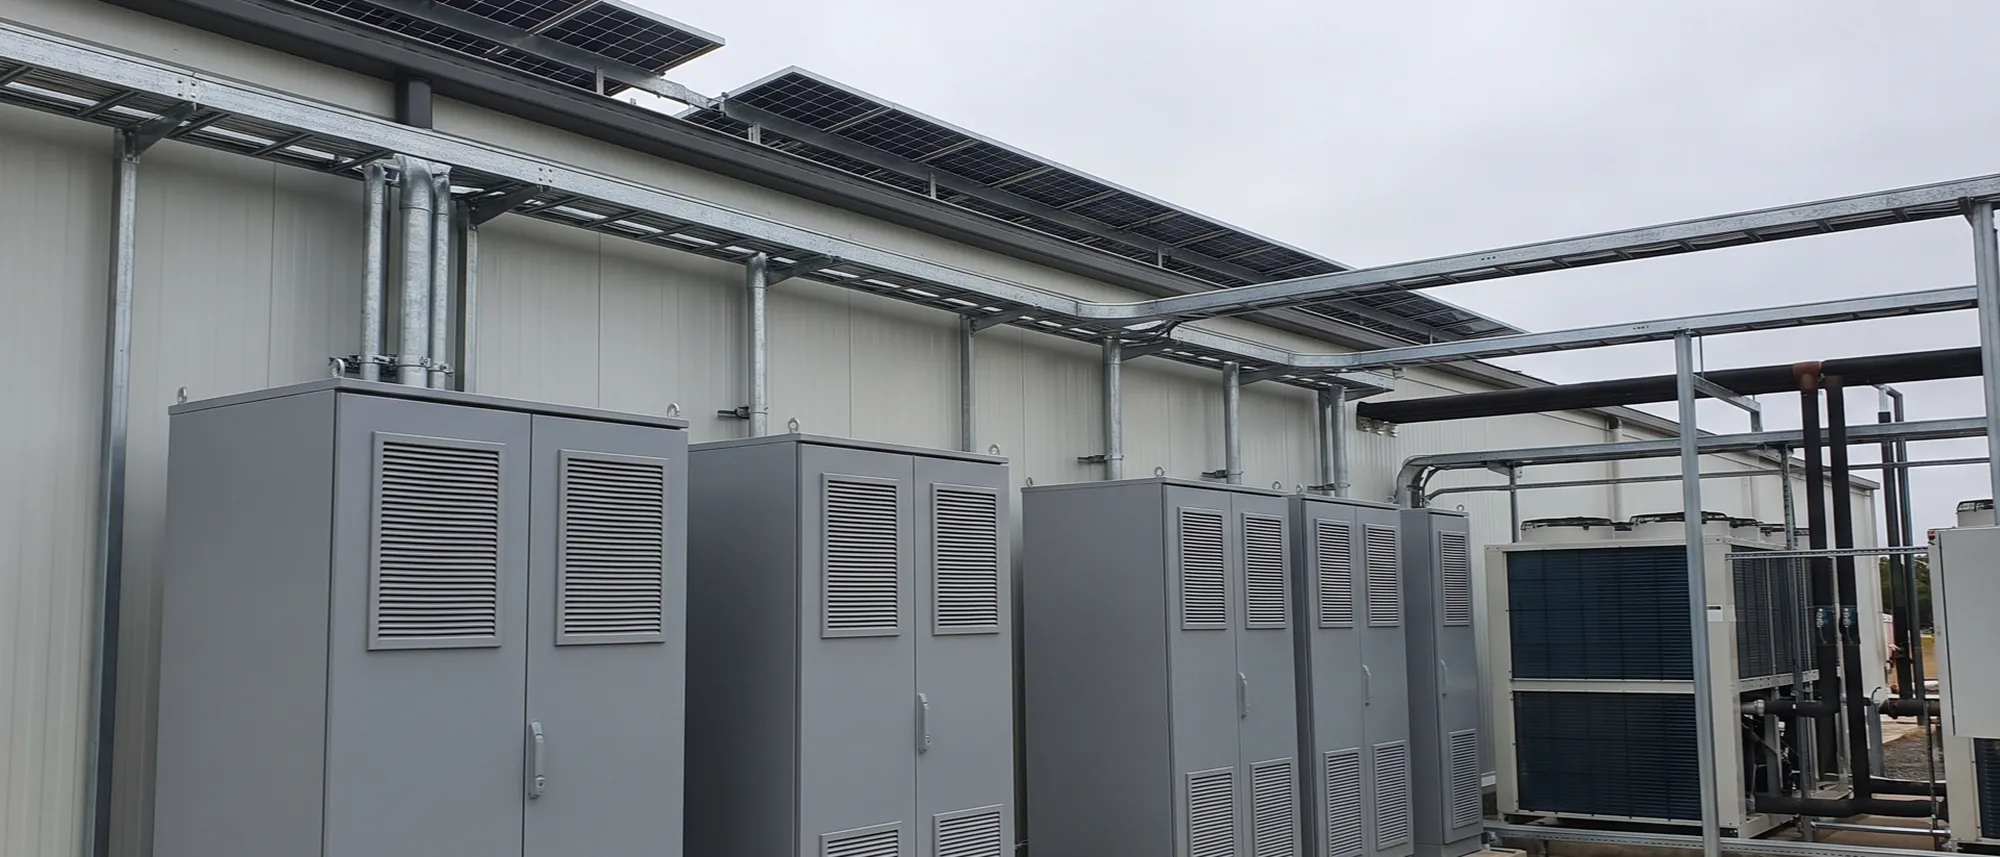
Roof area tells you how many panels fit. The building's own consumption tells you which of them will ever pay for themselves, and whether the battery on the quote should be there at all.
The roof answers the wrong question
Most commercial solar proposals start with a roof. Somebody measures the available area, divides it by a panel, and the number that falls out becomes the system size. It is quick, it is easy to quote against, and it answers a question nobody asked.
The question that matters is what the site actually uses, and when. A building with a large roof and a small daytime load is being sold panels that will spend their afternoons exporting at whatever the feed-in arrangement pays. A building with a modest roof and a heavy daytime load may be worth filling to the edge.
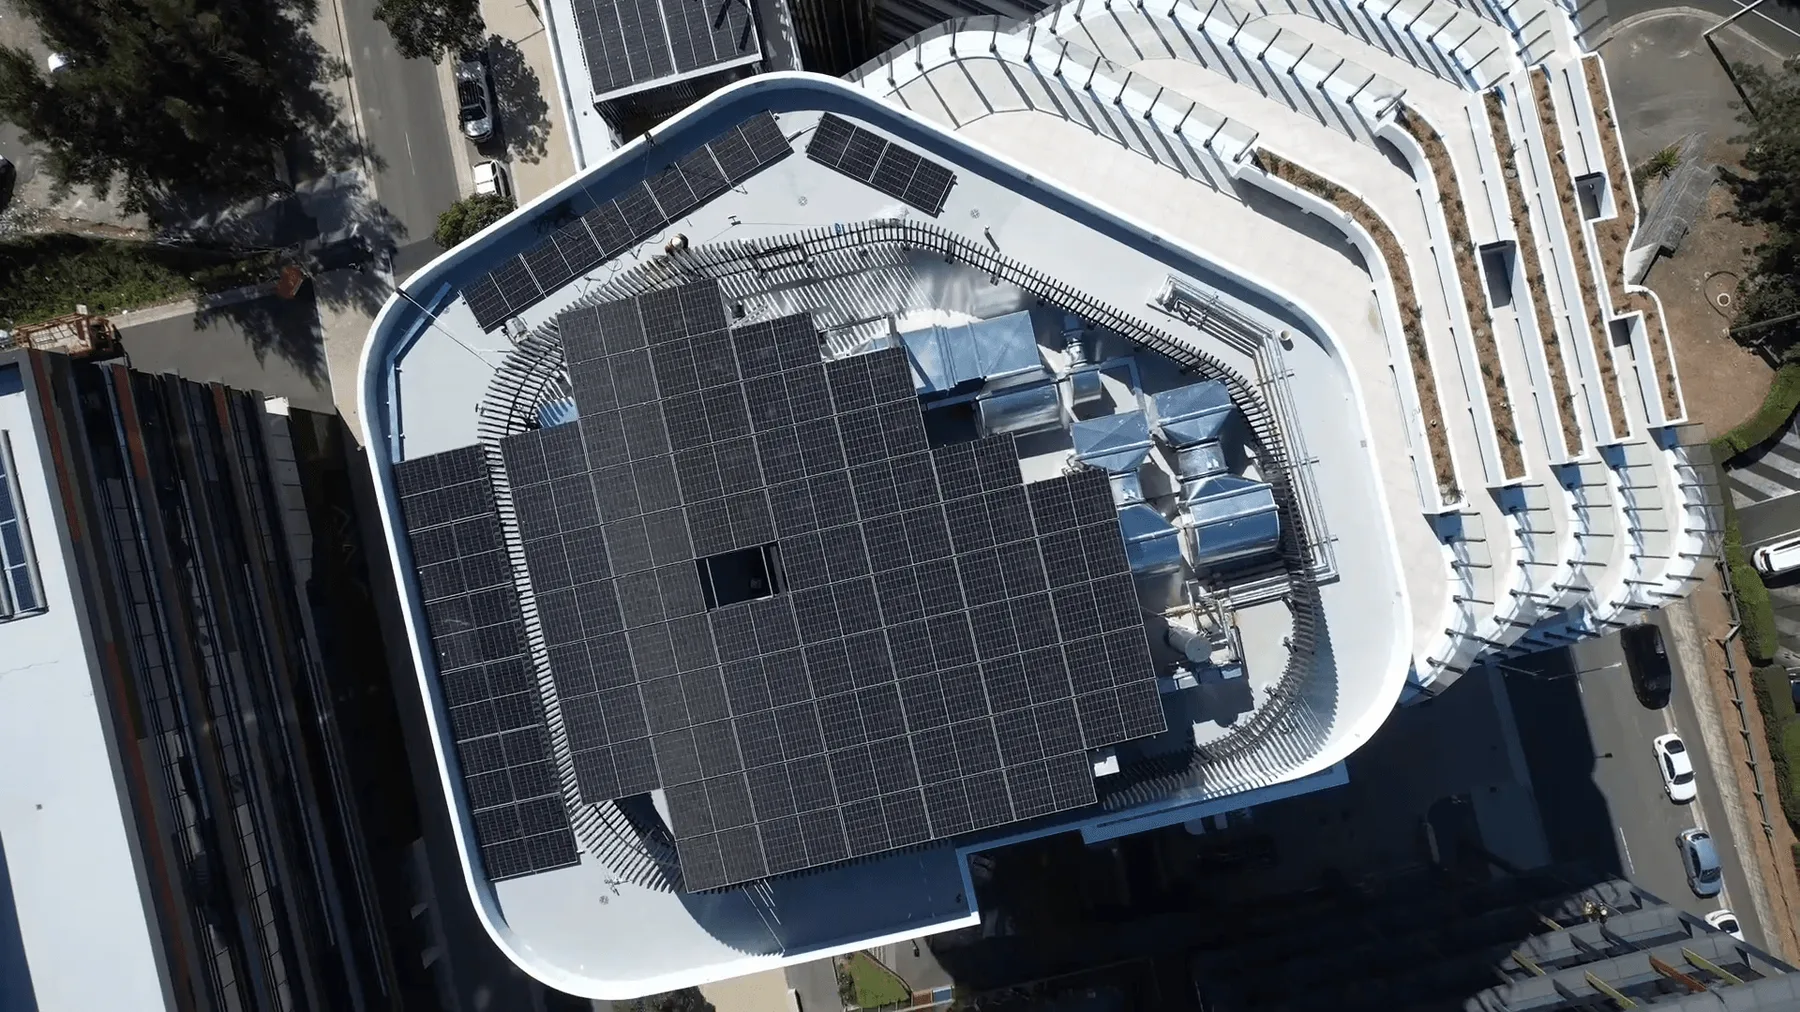
Neither of those is visible from an aerial photograph, and neither is visible from an annual bill. Both are visible in the building's own consumption record.
The habit persists because roof area is the one input a supplier can get without asking the customer for anything. It needs no permission, no bill and no site visit, which makes it the fastest route to a number on a page. Speed is the only thing it optimises for.
What interval data actually is
Interval data is a reading of the site's consumption at fixed intervals through every day it has been running. Your retailer holds it. They will release it to you, or to us with your written permission, and there is no charge for asking.
Ask for the finest resolution the meter records, and ask for a full year. A quarter of data describes a quarter. A full year carries the summer peak, the winter shape, the shutdown weeks and whatever the site does at the end of a financial year, and those are the periods that decide both the array and anything stored alongside it.
One reading of that record separates it from every other input: it shows when you draw, not how much. The bill already told you how much. It is the only number in the whole exercise that a roof measurement cannot improve on.
In practice the request takes a form, an account number and a signature, and the file comes back within a few business days. It arrives as a spreadsheet of timestamps and kilowatt-hours, which looks like nothing at all until it is plotted, at which point the building's working day appears on the page in a single line.
Model the load against the tariff
The load shape is modelled against the tariff you are actually on, before any array is sized. The tariff decides what a unit of generation is worth at each hour, and the load shape decides how many units land in each of those hours. Multiply them and you have the only forecast worth arguing about.
This is where the two-identical-roofs problem resolves. Two sites can carry the same roof, the same annual consumption and the same bill, and still want completely different systems.
| What differs | The early-start site | The summer-peak site |
|---|---|---|
| When the load sits | Draws hard from six in the morning, tailing off by three | Flat through the morning, peaking mid-afternoon in summer |
| What the array wants | Weighted east, generating before the load has passed | Weighted north and west, generating into the peak |
| What happens to the output | Nearly all of it consumed on site | A larger share exported, unless it is stored |
| What storage is for | Little spread to work with, so often nothing | Shifting the afternoon peak, so often something |
| What the annual bill shows | The same total | The same total |
Two load shapes described rather than measured, to make one point: the annual total is identical and the right system is not. Your own shape comes from your own data.
Tariff structure matters as much as tariff rate, and it is where most desk-built proposals quietly go wrong. A site on a flat rate is a straightforward calculation. A site on time-of-use has different hours worth different amounts, so generation has to land in the expensive ones to be worth what the proposal claims. And a site carrying demand charges is billed partly on its single highest interval of the month, which no amount of average generation touches.
This is also where a system stops being worth building. Where the modelled return does not justify the capital, the proposal should say so rather than quietly shrinking the scope until the number looks acceptable.
Where storage earns its keep
Storage is the most requested and least interrogated line on a commercial proposal.
Storage gets asked for by name more often than any other component, and it is the one most likely to be included because it was asked for rather than because it returns anything.
A battery earns its keep in three situations. When the tariff carries a spread worth arbitraging. When demand charges can be shaved, which is often the largest of the three and the least discussed. Or when an outage genuinely costs the business money, which is a resilience question rather than a return question and should be priced as one.
If none of the three applies at the site, the storage is a capital cost with a maintenance schedule attached. So it gets modelled the same way the array is, against the load shape and the tariff, before a capacity figure goes on paper. Sometimes the answer is a smaller battery. Sometimes it is no battery yet, and a switchboard specified to take one later without being rebuilt.
Saying that at quote stage is less comfortable than including it. It is also the only version of the conversation that survives the twenty years the system is supposed to run for.
Two figures decide a battery and they are routinely conflated. Capacity, in kilowatt-hours, decides how long it can supply. Power, in kilowatts, decides how much it can supply at once. A demand-charge problem is usually a power problem, and it can be solved by a smaller, punchier battery than the one on the quote.
What bounds the result
Two constraints cap the answer regardless of what the model wants, and both are established on site rather than at a desk. The network's export limit caps what can be sent back, which changes the value of every unit generated above the site's own draw. The switchboard caps what can be connected at all.
Neither is re-argued here, because both are settled elsewhere: the four site-side inputs that decide a commercial array, and what each one settles, are set out in the companion piece to this one. What matters for the model is that both are written into the proposal as stated assumptions rather than left implicit, so the arithmetic can be checked against them later.
Both take an afternoon to establish and a variation to discover late. A model built without them is not wrong so much as unbounded, and an unbounded model produces a number that no site can actually deliver.
A worked example
Two Murray Rose Avenue, Sydney Olympic Park, is a 59.4 kW array on a crowded roof, delivered around half-metre code clearances and a concrete deck that had to stay waterproof. Where Level 15 ran out of room, the dual-glass panels became the roof of a custom steel canopy.
| Measure | Result |
|---|---|
| System size | 59.4 kW |
| Generated each year | 89,264 kWh |
| Estimated annual saving | $8,728 |
| Estimated saving over its life | $212,213 |
| Carbon dioxide avoided each year | about 73 tonnes |
The generation figure is a measurement from the installed system. The saving figures are estimates derived from it against the site's tariff, not projections from a price list.
The reason that job is worth printing is not the size. It is that the constraint which decided the design was the roof's clearances, and the model had already told everyone what the building needed before anybody argued about where it would fit.
After commissioning, the model is the test
Monitoring runs from day one and output is checked against the model that produced the proposal. That comparison is the entire point of writing the assumptions down.
A system that underperforms its model is a fault to find, not a disappointment to absorb. Without a written model there is nothing to underperform against, and a quiet ten per cent shortfall is indistinguishable from a cloudy month for as long as anybody cares to look.
The check that matters most happens at twelve months, when the system has seen a full cycle of the same seasons the model was built from. Anything before that is comparing a fragment against a year. Anything after it, without a written model to compare against, is comparing this year's bill to last year's and calling the difference performance.
You receive the commissioning documents and the warranties, and a servicing schedule is agreed. Faults are flagged from the data rather than from a bill that surprises somebody three months later.
Keep reading
Demand charges are a different bill
An energy charge bills the kilowatt hours a site used. A demand charge bills the single highest interval it reached. They respond to different…
Read TechnicalPower quality is the other half of the connection
A connection agreement says what a site may export. Power quality decides what it actually manages to. Voltage, power factor and harmonic content…
Read TechnicalFour numbers decide the array
Usable roof area, load shape, switchboard headroom and the connection position set the system size between them. The roof is one of the four, and…
Read